Difference between revisions of "ViSUS Data Portal"
(→Explore Data) |
|||
| Line 68: | Line 68: | ||
From here you can visualize the data using the [[ViSUS_WebViewer | Web Viewer]]. | From here you can visualize the data using the [[ViSUS_WebViewer | Web Viewer]]. | ||
| − | [[File:Hearth.png|center| | + | [[File:Hearth.png|center|500px]] |
Revision as of 23:53, 18 January 2019
The ViSUS Data Portal allows to easily configure your data on the server, convert data to a data-streaming friendly format and visualize them directly from your browser. The ViSUS Data Portal is deployed as a Docker container. Here is how to get started.
Quick start
Start your Docker and login into your account. If you don't have installed follow these instructions: Docker Documentation
Now pull the ViSUS image:
docker pull visus/dataportal
This image contains:
- the ViSUS Server
- configuration files (see ViSUS configuration file)
- a simple 2D/3D web viewer
- some tools to convert data (see ViSUS Convert).
The goal of the data portal is to allow to use all of the above tools from a web interface, so all you have to do is just run the container with
docker run -it --rm -p 8080:80 visus/dataportal
and point your browser to that same port (8080) on your host, as following: URL: http://localhost:8080
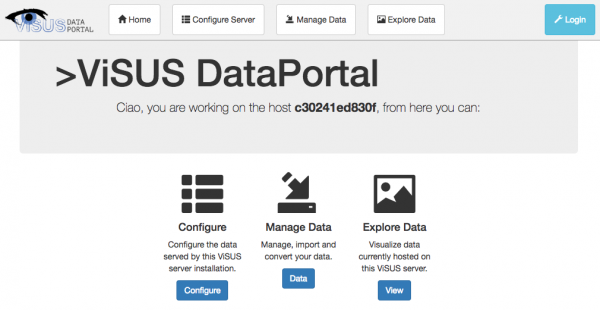
From the main navigation bar you can reach three different areas that will be presented in the next sections.
You can change those and other settings from the local.php file, that you can mount when you run your docker as following:
docker run -it --rm -p 8080:80 -v my_local.php:/home/visus/dataportal/local.php visus/dataportal
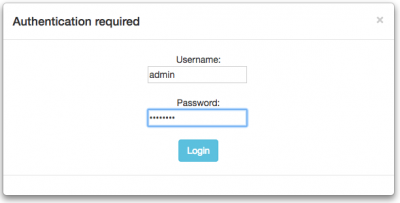
Note: the default credentials are: username=admin, password=password.
Configure Server
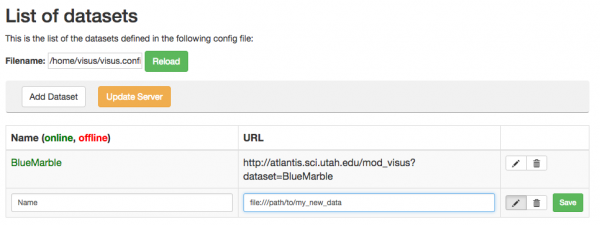
From here you can visualize and edit the list of the datasets that you are serving through this server. Those can be both remote datasets (i.e., with a web URL as in the case of the default dataset BlueMarble) or local (i.e., pointing to an actual file hosted on the server).
The name of the dataset is colored in red or green to show you if that dataset is ready for streaming or not. To update the server you can click the "Update Server" button to trigger a reload of the datasets (metadata) on the server.
Manage Data
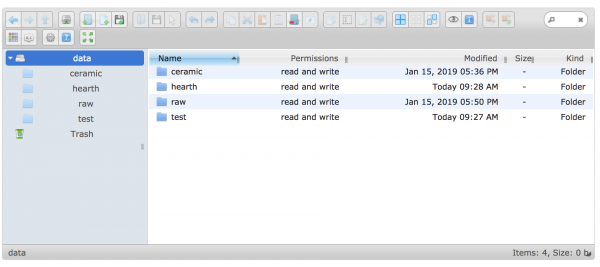
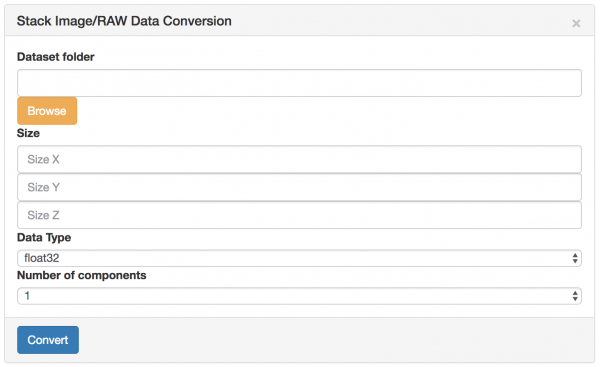
From here you can explore the data hosted on the server using the "File Manager" and execute conversions. Currently the data portal provides interface to convert single or stack of image (or raw) data.
The conversion process will look into the selected folder for images in order to estimate the size and datatype and automatically fill up the conversion parameters for you. The user can eventually customize those and run the conversion with the "Convert" button.
When a conversion process is launched a new entry in the conversion history will show up. This history allows the user to monitor the conversion processes taking place on the server and visualize the corresponding logs. From this list is possible to add the converted (or still converting) dataset to the server using the "Add to server" button.
Explore Data
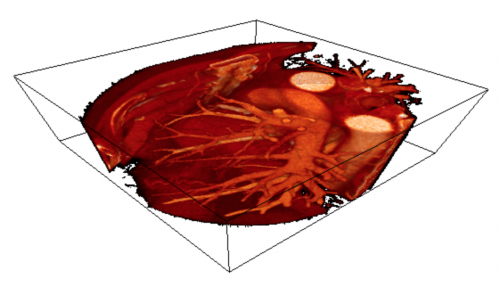
From here you can visualize the data using the Web Viewer.

