Scripting Node
The scripting node allows to perform operations on the data using a javascript-like syntax.
This node can be added to any other node, for example a Volume Node (i.e. to produce a volume rendering of the data).
Examples using a vector field
In the following examples we will use a vector field from a large scale combustion dataset. You can open this dataset with your ViSUS Viewer using "Open URL" and this address: http://atlantis.sci.utah.edu/mod_visus?dataset=lifted_time
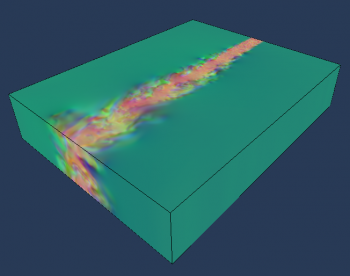
A Volume Node for a vector field will visualize a volume rendering as following:
Since the data has 3 components the default visualization uses the 3 components as RGB channels.
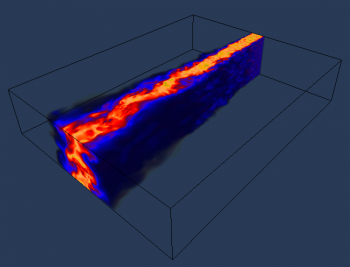
If we want to evaluate and visualize the squared magnitude of this (three-dimensional) vector field the user can simply insert a scripting node with the following script:
output=
 ((1.0*input[0])*input[0]) +
 ((1.0*input[1])*input[1]) +
 ((1.0*input[2])*input[2]);
Where the input field represent the input data that enter the scripting node, the output represents the result of the computation.
The output will be a scalar field that will be rendered as following:
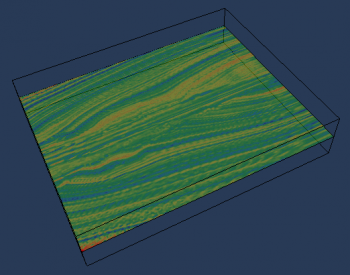
Another example using a vector field is to compute a 2D Linear Integral Convolution (LIC), this can be done using the following simple script:
output=Visus.Array.lic(input,0,1);
where the second and third parameters of the lic function are the vector's components that we want to use for the computation.
The result will be like this (using a "Banded" palette):


